

Here is a snippet of a conversation that I often have when I first meet someone and we start discussing how their website should be a primary sales generator for their business.
====
Them: “Hey Greg, could you please look at my website and give me some suggestions to improve it?”
Me: “I’d be happy to. For the best insights, I’d like to review your analytics reports.”
Them: “Um, OK. I think we have those somewhere. I’ll have to figure out who has that login and get back to you.”
Me: (silently and very politely) “Sigh…”
====
John Wanamaker, a pioneer of modern marketing and advertising in the early 20thcentury, is credited with saying, “Half the money I spend on advertising is wasted; the trouble is I don’t know which half.”
One of the big advantages of digital marketing is the ability to track and measure the effectiveness of your efforts and investments, yet so many are missing out and not utilizing the analytics technology to its fullest potential, or even at all.
How often do you review your website analytics reports? Daily, weekly, monthly, quarterly, occasionally… or hardly ever? To be fair, you are busy, and those reports can be a bit overwhelming at times. But the data in your website analytics reports has amazing insights to help maximize the return on your marketing investments.
Don’t throw away money because you aren’t comfortable measuring performance. With just a little bit of extra configuration effort, a focus on the key reports and metrics, and maybe even investing in some guidance from experts to help understand the data better, these reports will make all the difference.
At Blue Tangerine, we recommend that you use Google Analytics as the tool to track your website activity. Google Analytics is a very popular program due to its low cost combined with its very robust reporting capabilities and ease of use. Here are a few tips and tricks specific to enhancing your Google Analytics setup that will dramatically improve the value of the data and reports that you receive.
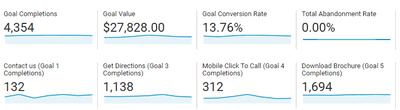
Tip #1: Add Goals
Tip #2: Add Event Tracking
Here are a few examples of events that you should consider tracking:
- Downloading a PDF file (i.e. brochure, ebook, spec-sheet, etc.)
- Clicking a link to an external websites such as your social media profiles, Google Maps for directions, etc.
- Clicking mobile click-to-call phone number links
- Clicking email (mailto) links
- Playing videos
- Initiating an online chat session
In addition to using events to gain increased understanding about how users interact with your website overall, events can also be configured as goals (see above) and provide all the conversion tracking data that go along with goal configuration.
Note that setting up event tracking involves editing the code on your website and will likely require support and involvement from your website developer.
Tip #3: Assign Goal Values
You are investing good money in SEO, paid search, social media, email marketing efforts, and more. Are you getting the kind of return that you want from those investments? How can you improve that return? Where do you need to focus your efforts?
Now that you have added events and goals, adding goal values to your analytics reports allows you to start answering these types of questions. Different customer actions have different values to you. Google Analytics gives you the ability to assign a dollar value to the completion of each type of website goal. Once your goals are associated with a dollar value, it opens the opportunity to numerically measure the effectiveness of your various marketing efforts and campaigns and compute a return on investment at a much more granular level.
So how do you determine the value of a goal completion? For a transaction like a product sale on an e-commerce website, the number may be clear. But for non-transactional goals, like completing a contact form or subscribing to a newsletter, the number will be less obvious and somewhat subjective.
In an ideal scenario, you will have a good feel for the value of a new sales lead. For a quick calculation, take the total sales from the last year and divide that by the total leads you received that generated those sales. However, if you haven’t been tracking those numbers yet, then here are a few suggestions of some default values to help get you started.
• Contact Us Form Submission – $30
• Mobile Click to Call – $30
• Brochure Download – $4
• Get Directions Link – $4
As you improve your reporting and results tracking over time, you will want to revise these numbers accordingly. Start where you are comfortable.
Tip #4: Use Campaign Tracking Codes
Campaign tracking codes sometimes referred to as “UTM parameters”, allow you to identify individual links as well as group them together into sources and campaigns. Once you have these tracking codes added to the links to your site that you post in other places, you will be able to see the results of specific email marketing messages, banner ads, social media posts, etc. in the Traffic Sources and Campaign reports.
While you should give some thought to how you want to name your sources and campaigns, once you have a plan it is not difficult to create the necessary links. Some email marketing programs and social media publishing tools even have processes already built in to help configure these tracking tags. Google has also provided its URL builder tool at https://ga-dev-tools.appspot.com/campaign-url-builder/ to help.
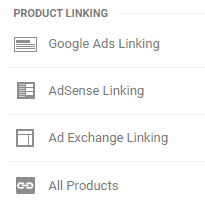
Tip #5: Product Linking
Tip #6: Annotations
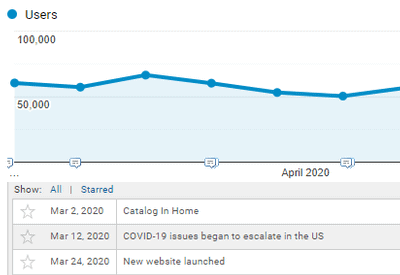
Some examples of useful annotations may include:
- Specific offline marketing campaigns
- Grand openings or other events
- New website launch or significant feature addition
- External news story or article that drove a traffic and interest spike
- Tracking issue or site offline that messed up your report data
- Weather extremes that impacted your business
- Competitor promotions
Annotations can be added via any of the Overview Reports or within the Google Analytics admin area. One thing to note is that currently annotations cannot be added for dates in the future. It would be nice to be able to add them in advance when you were setting up campaigns and promotions, but since you can’t, be sure to make a note to go back and add them after the event has happened.
Tip #7: Enhanced Ecommerce Tracking
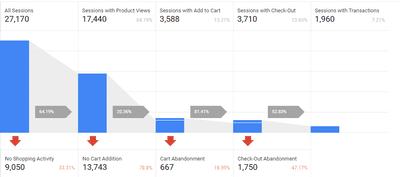
These reports let you gain insight into buyer behavior before the sale is completed, which can be especially helpful to understand where buyers might be getting stuck and not completing the purchase. Setting up the enhanced e-commerce tracking is somewhat complex and requires your web developer to assist with the implementation.
Tip #8: Custom Dimensions
- Ecommerce (Product page, Category page)
- Home Builder site (State, Metro, City, Community, Model)
Setting up custom dimensions requires adding some additional tags and logic to each page of the site, as well as some time to setup custom reports within Google Analytics to use this data. Your web developer’s help will be appreciated.
Get Started
While Google Analytics is a useful tool just using the base tracking tag on your website, by investing a little bit more time and effort in configuring your site and the reports, you can dramatically expand and enhance the value of the data that you have available. Better reports will lead to a better understanding of how your digital marketing efforts and your website are helping drive new leads and sales. And a better understanding of what is working and where improvements could be made will help you grow your return on your online marketing investments.
If you are ready to have Google Analytics reports that you can actually use, contact Blue Tangerine today, our team of analytics experts and developers will help you get all of the tags added to your website, get the reports configured and ready to go, and then make you look like a rock star to your boss by showing you useful insights every month so you can make data-driven marketing decisions.
